File:Chanchu 2006-05-10 2111Z QuikSCAT.jpg

原始檔案(974 × 974 像素,檔案大小:1.9 MB,MIME 類型:image/jpeg


描述

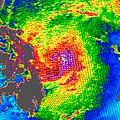
Typhoon Chanchu Typhoon Chanchu is shown here as observed by NASA’s QuikSCAT satellite on May 10, 2005, at 21:11 UTC (5:11 a.m. May 11 local time). At this time, the typhoon had 140 kilometers per hour (85 miles per hour; 75 knots) sustained winds. At the time of this observation, Chanchu had just crossed the threshold to typhoon status only a few hours later, having been classified as a weaker tropical cyclone in the previous two days since the storm system formed.

The image depicts wind speed in color and wind direction with small barbs. White barbs point to areas of heavy rain. The highest wind speeds, shown in purple, surround the center of the storm.

Measurements of the wind strength of Typhoon Chanchu show sustained winds slightly higher than those shown by QuikSCAT observations. This is because the power of the storm makes accurate measurements difficult. The scatterometer sends pulses of microwave energy through the atmosphere to the ocean surface, and measures the energy that bounces back from the wind-roughened surface. The energy of the microwave pulses changes depending on wind speed and direction, giving scientists a way to monitor wind around the world.

Tropical cyclones (the generic term for hurricanes and typhoons), however, are difficult to measure. To relate the radar energy return to actual wind speed, scientists compare measurements taken from buoys and other ground stations to data the satellite acquired at the same time and place. Because the high wind speeds generated by cyclones are rare, scientists do not have corresponding ground information to know how to translate data from the satellite for wind speeds above 50 knots (about 93 km/hr or 58 mph). Also, the unusually heavy rain found in a cyclone distorts the microwave pulses in a number of ways, making a conversion to accurate wind speed difficult. Instead, the scatterometer provides a nice picture of the relative wind speeds within the storm and shows wind direction.
日期 21:10, 13 May 2006 (UTC)
來源 http://earthobservatory.nasa.gov/NaturalHazards/natural_hazards_v2.php3?img_id=13571
作者 NASA image courtesy of David Long, Brigham Young University, on the QuikSCAT Science Team, and the Jet Propulsion Laboratory.
授權許可
(重用此檔案)
USGov-PD


Public domain 本作品由NASA創作,屬於公有領域。根據NASA的版權政策:“NASA的創作除非另有聲明否則不受版權保護。”(參見:Template:PD-USGov/zhNASA版權政策JPL圖像使用政策
警告:

說明

添加單行說明來描述出檔案所代表的內容

在此檔案描寫的項目

描繪內容

多媒體型式 繁體中文 (已轉換拼寫)

image/jpeg

校驗和 繁體中文 (已轉換拼寫)

c5131cf05985b8f7370948a2fb6c03a6f7450837

斷定方法:​SHA-1 中文 (已轉換拼寫)

1,993,911 位元組

974 像素

974 像素

檔案歷史

點選日期/時間以檢視該時間的檔案版本。

日期/時間縮⁠圖尺寸用戶備⁠註
目前2006年5月13日 (六) 21:10於 2006年5月13日 (六) 21:10 版本的縮圖974 × 974(1.9 MB)Mosesofmason{{Information| |Description= Typhoon Chanchu Typhoon Chanchu is shown here as observed by NASA’s QuikSCAT satellite on May 10, 2005, at 21:11 UTC (5:11 a.m. May 11 local time). At this time, the typhoon had 140 kilometers per hour (85 miles per hour; 7

下列頁面有用到此檔案:

全域檔案使用狀況

以下其他 wiki 使用了這個檔案:

詮釋資料